Interactive Results
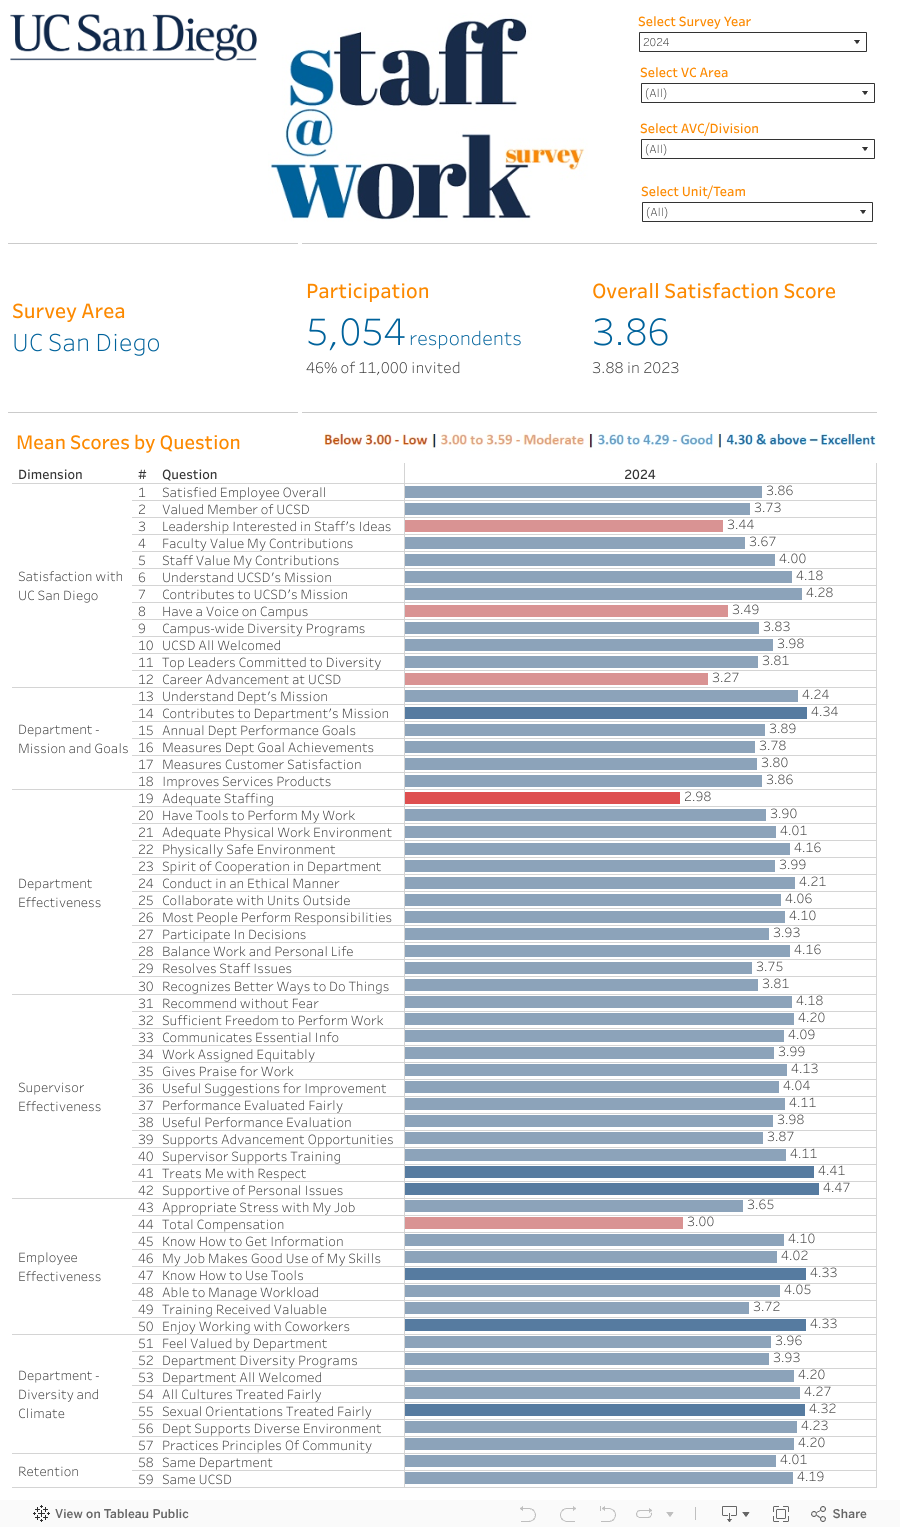
The dashboard below gives you multiple ways to view the survey results. The 'Summary' tab allows you to select from the list of VC Areas, AVC/Divisions, and Units/Teams to view the total number of respondents, overall satisfaction score, and overall score of the 59 survey questions. The 'Scatterplot' tab allows you to view the Influential Strengths and Primary Opportunities of the selected VC Area, AVC/Division, and Unit/Team, and shows where each survey item falls on the map of Strengths versus Opportunities, based on each item mean’s correlation with overall satisfaction.
Note: Scatterplot graphs are available for units with 25 or more responses. "Null" indicates groups with fewer than 5 respondents, therefore, results are not shown to protect anonymity.
View actions taken based on survey feedback.