2025 Student Satisfaction Survey Results
The interactive dashboard below allows you to filter by department to view their response rate and satisfaction scores for the current year.
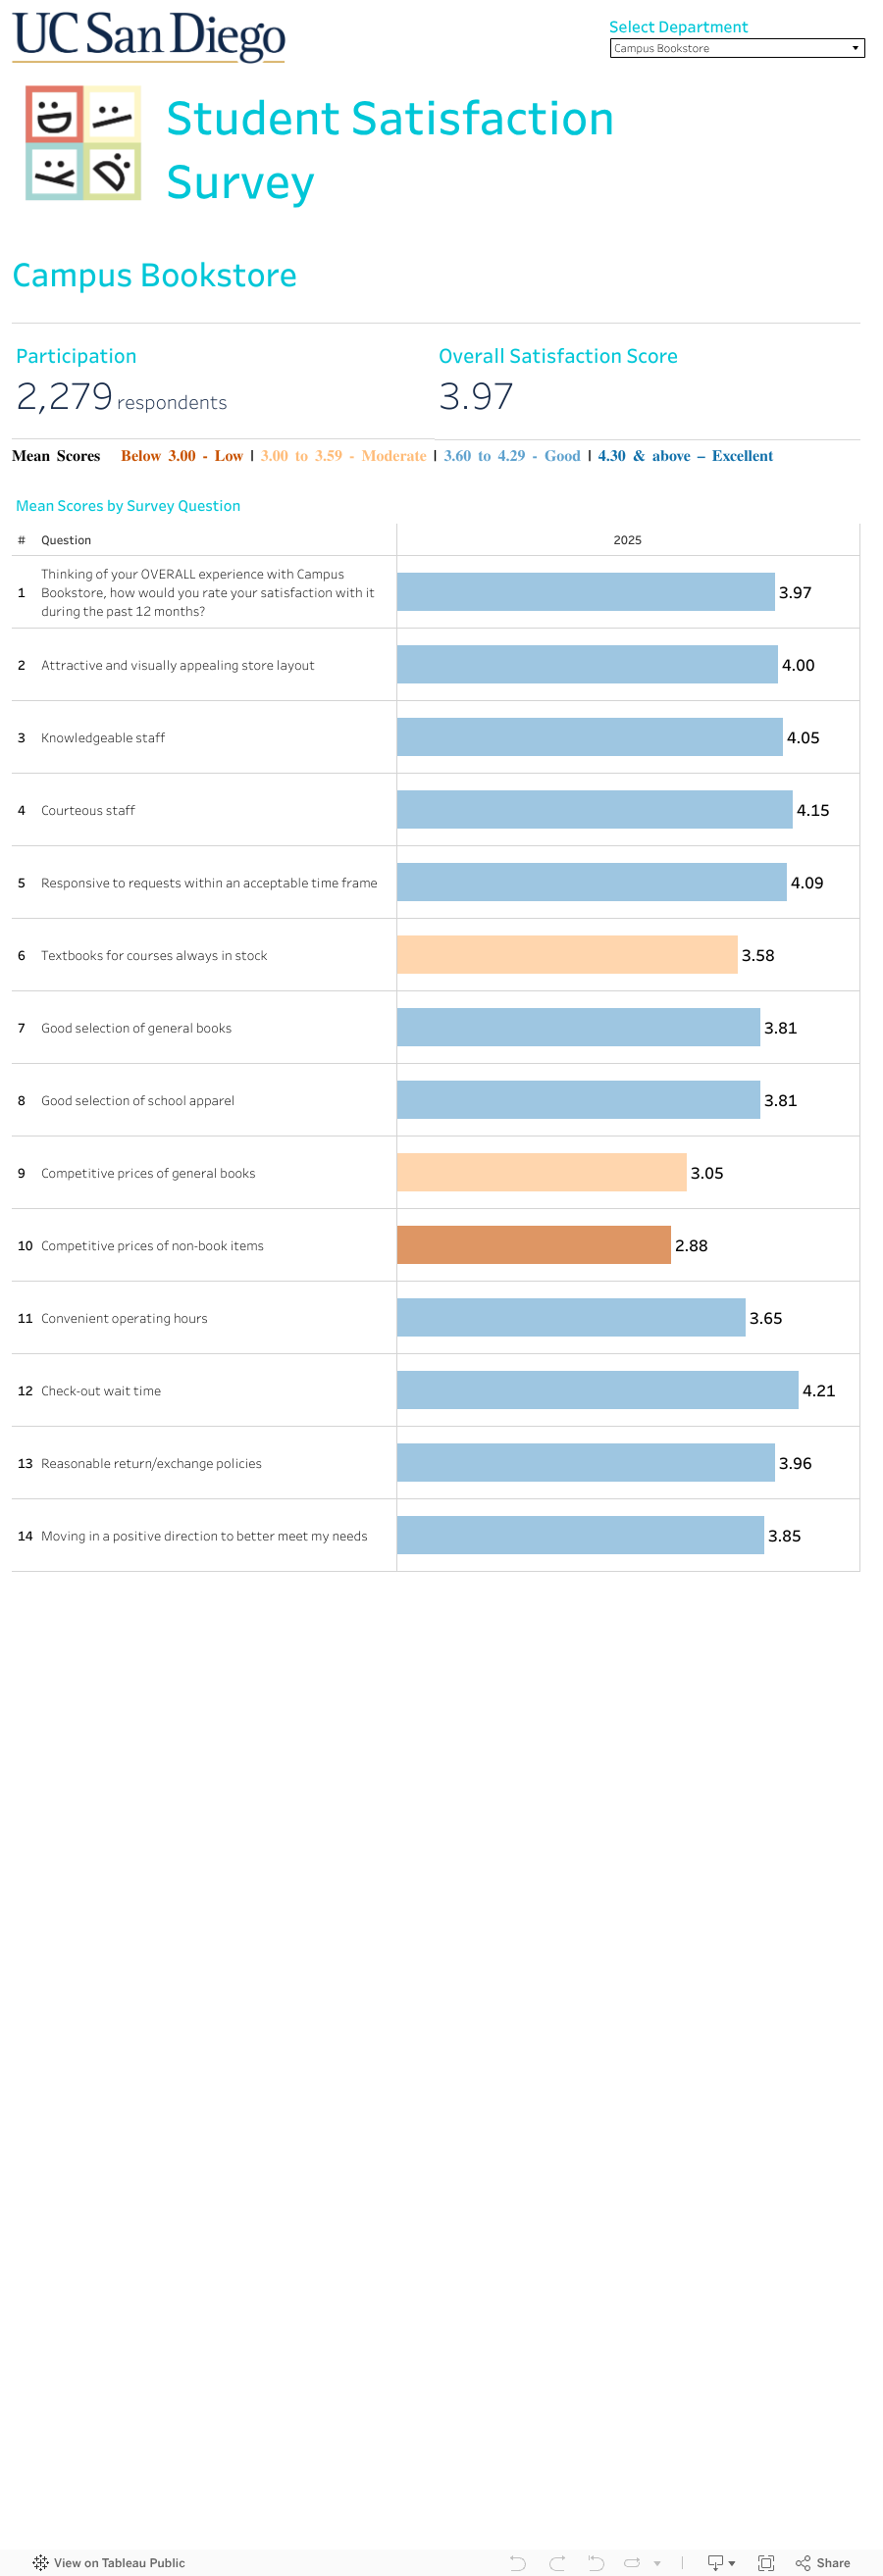
The interactive dashboard below allows you to filter by department to view their response rate and satisfaction scores for the current year.